Sophie Renet , Élise Rochais , Cynthia Tanguay , Kevin W Hall , Jean-François Bussières
Hospital pharmacy practice has undergone many changes over the past 3 decades.1–3 New technologies, such as automated repackaging, robotic unit-dose cart-fill systems, and automated dispensing cabinets, have improved the efficiency, effectiveness, and quality of drug distribution systems. In addition, new pharmacy practice models have been introduced in which pharmacists accept responsibility and accountability for managing drug therapy (e.g., pharmaceutical care, medication therapy management). There is an abundance of evidence regarding the benefits of many pharmacy services for the quality and effectiveness of health care,4–8 but the uptake of many evidence-based services has been slow and incomplete. As such, there is a relative paucity of literature about the decision-making processes that pharmacy managers and practitioners use to prioritize the pharmacy services that they provide. Given that available human and financial resources are limited, it is important for pharmacy managers and others in the profession to identify and understand the basis for their prioritization decisions. More specifically, they need to understand if the portfolio of services provided by a particular pharmacy department is evidence-based, preference-based, or a result of random opportunities that have arisen in the hospital.
A simulation exercise was developed to examine how hospital pharmacy managers make prioritization decisions. The primary objective of the exercise was to examine the consistency of pharmacy managers’ prioritization decisions in a simulated environment with constraints on available resources. The secondary objective was to rank the factors influencing prioritization decisions and to compare individuals’ and teams’ rankings of these factors.
A simulated prioritization exercise was created and conducted during a symposium attended by 39 anglophone and 10 francophone pharmacy managers from all regions of Canada (the Millcroft Hospital Pharmacy Leadership Conference, held in Alton, Ontario, in June 2011). The exercise was conducted in English, with supplemental instructions provided in French for those who requested it. The pharmaceutical activities used in the exercise and their relative resource requirements were established by the research team on the basis of data from the Hospital Pharmacy in Canada 2009/2010 Report 9 and the team’s knowledge of hospital pharmacy practice. The simulation exercise and the tools used in the exercise were pretested with a group of 6 pharmacy interns.
Each pharmacy manager was assigned to 1 of 8 groups, each of which consisted of 6 or 7 individuals. Each group was deemed to represent a virtual pharmacy department. The research team randomly identified one member of each group to act as the leader of the virtual department. This person was responsible for ensuring that the exercise was completed within the allotted time.
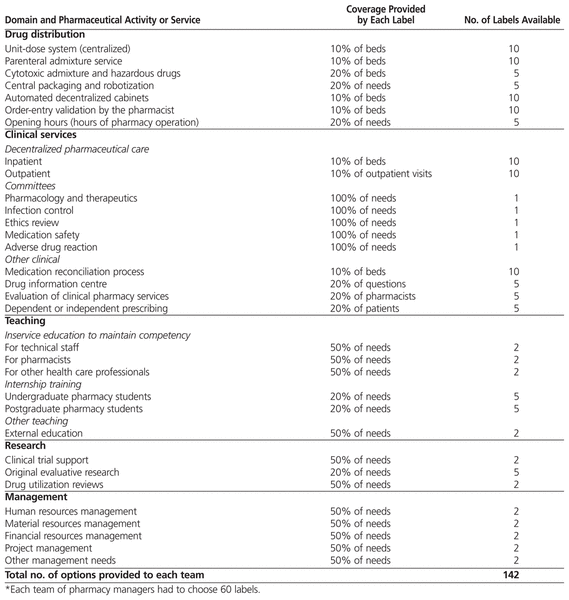
Each team was given the following written instructions. “You are acting as the pharmacy management team for a new 300-bed teaching hospital, which operates within a health care system that faces financial, human, and material constraints. For the purpose of this simulation, pharmaceutical practice has been divided into 5 domains: drug distribution, clinical services, teaching, research, and management. You have been given a set of 142 coloured labels, representing a total of 32 pharmaceutical activities and services (Table 1). Each label represents about the same amount of resources to be expended for that service or activity. The labels are colour-coded, according to the 5 domains of pharmacy practice: green for drug distribution, white for clinical services, red for teaching, blue for research, and brown for management. You have 30 minutes to select the pharmacy services that your department will provide. Please select, and paste on your group’s posterboard, the 60 labels representing priority activities for your hospital. The 60 labels will represent all the funding that you have for pharmaceutical activities and services. You may decide to only partially implement a service (e.g., a service for only 50% of beds) or to fully implement a service (i.e., 100% of beds).”
Table 1
Labels Available for Prioritization of Activities in Hospital Pharmacy Practice*
After the teams had completed the prioritization exercise, each participant was given a list of 16 factors that might have influenced the prioritization decisions and was asked to rank the relative importance, from highest to lowest (1 to 16, respectively), of each factor in their decisions. Thereafter, the team leaders were asked to lead a group discussion of the ranking and to come up with their groups’ consensus on the relative importance of each factor in the prioritization decisions. Participants were given a total of 15 minutes to perform these individual and group rankings of factors influencing prioritization decisions. The next day, a synthesis of the results was presented to the participants, followed by a discussion about decision-making in the health care sector.
The primary objective, to examine the consistency of prioritization decisions made in the context of limited resources, was measured in 3 ways. First, a photo of each group’s prioritization scheme was examined, and the labels from each domain were counted. This allowed calculation of the number of activities covered per team. An activity was considered to be “covered” if at least one label had been applied. Second, the relative weight attributed to each domain was calculated by dividing the total number of points attributed to a domain by the total number of points used by the team. One point was assigned for each 1% of a service covered by the labels selected. Third, the extent of coverage per activity was calculated for each team.
The secondary objective was measured by averaging the individual ( n = 49) and team ( n = 8) rankings for each factor that might have influenced prioritization decisions. These averages were then used to re-rank the factors from 1 to 16 for both individuals and teams. The correlation between individuals’ and teams’ average rankings was determined with Spearman’s rank correlation coefficient. A p value less than 0.05 was considered statistically significant. A high correlation coefficient (value close to 1) points to a strongly positive relationship between individual and team rankings. A negative correlation coefficient points to a negative relationship between individual and team rankings.
For all numeric analyses, the data were entered into a Microsoft Excel 2010 spreadsheet (Microsoft, Seattle, Washington).
On average, the teams covered 24 ± 4 (mean ± standard deviation) of the 32 activities (Figure 1). While the majority of teams (6 of 8) prioritized more than two-thirds of the 32 suggested pharmaceutical activities, 2 of the teams prioritized fewer activities (18/32 and 16/32, respectively) to allow more comprehensive coverage of those services that they did decide to provide.
|
|
||
|
Figure 1 Example of a team’s prioritization of pharmaceutical activities and services. The colour-coding used in the simulation exercise for the 5 domains of pharmaceutical activities is represented here by graphic patterns. ADC = automated decentralized cabinet, PAS = parenteral admixture service. |
||
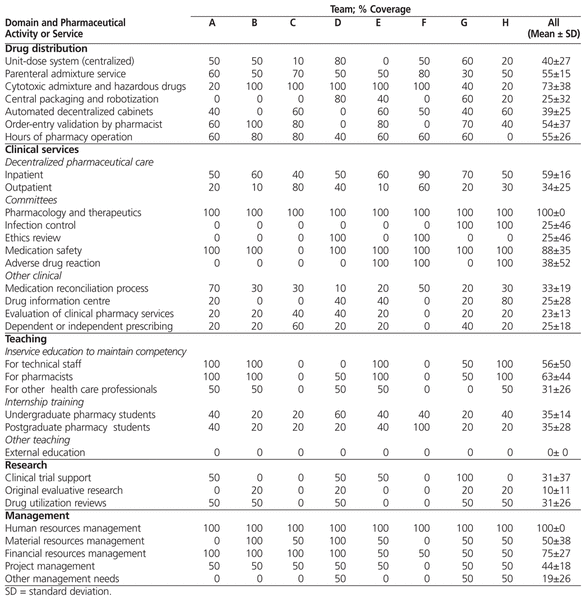
Averaged over all 8 teams, the relative weights attributed to each domain of pharmacy practice were 34% for clinical services, 24% for drug distribution services, 21% for management activities, 16% for teaching services, and 5% for research activities (Table 2). The extent of coverage for individual activities and services varied greatly from one team to another. For example, for 19 of the 32 activities, the range in coverage spanned more than 60 percentage points, and there were 9 activities for which coverage ranged from 0% to 100% (Table 3).
Table 2
Prioritization of 5 Domains of Hospital Pharmacy Practice

Table 3
Prioritization of Pharmaceutical Activities

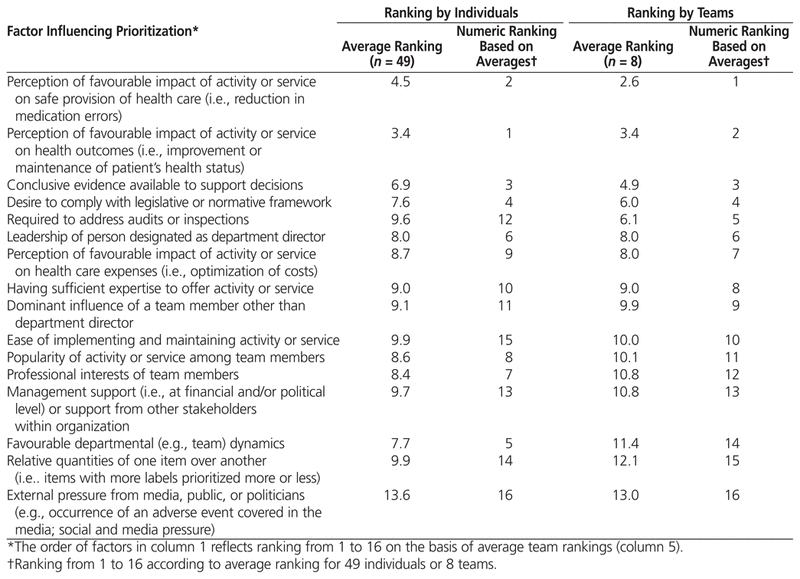
Table 4 presents the ranking of factors influencing individual and team prioritization decisions. Spearman rank correlation coefficients between the average individual ranking and the average team ranking for each factor were as follows (listed from highest to lowest): 0.909 for Team E ( p < 0.001), 0.826 for Team B ( p < 0.001), 0.735 for Team C ( p = 0.001), 0.688 for Team H ( p = 0.003), 0.538 for Team G ( p = 0.031), 0.418 for Team A ( p = 0.11), 0.215 for Team D ( p = 0.42), −0.521 for Team F ( p = 0.039).
Table 4
Individual and Team Ranking of Factors Influencing Prioritization

Most of the 8 teams of pharmacy managers involved in the simulation exercise opted to provide a wide range of services, but at a low level of comprehensiveness. The majority (6 of the 8 teams) included more than two-thirds of the 32 possible pharmaceutical activities and services in their prioritization decisions. In the complex world of health care, pharmacy leaders may feel pressured to provide a wide range of services targeted to individual patients in greatest need. For example, pharmacists may provide medication reconciliation services, but only to selected high-risk patients. The other 2 teams appeared to make a decision to focus on a smaller number of activities and services and to direct their resources to providing more comprehensive services in these areas.
The relative weights for activities and services ranged from 5% for research to 34% for clinical services (Table 2). Interestingly, the teams prioritized more clinical activities (range 24% to 49% of total points) than drug distribution activities (range 14% to 37% of total points).
Although the relative weights attributed to each pharmacy practice domain can be considered consistent, there was high variation in the coverage of individual activities or services by each team (Table 3). Among other observations, it was noted that pharmacy leaders gave high priority to human resource management (with all teams covering 100% of needs in this area) and financial management. Surprisingly, 3 of the teams chose to cover 50% of “other management needs”, even though many pharmacy service needs were not prioritized by these teams. The prioritization of management needs may simply reflect the priority that managers give to their own needs or may reflect a desire to have resources available to deal with the unpredictable problems that inevitably arise in most pharmacy departments. Other activities that were given low prioritization included original research by members of the pharmacy department, provision of education to external groups, and provision of support for clinical trials. Of concern, pharmacy managers gave a low priority to experiential training for undergraduate students.
In the Hospital Pharmacy in Canada 2009/2010 Report , Bussières noted that the majority of clinical activities that were given a high priority score by survey respondents were ones for which there is little evidence to support their economic or clinical value.9 This pilot simulation study identified a number of factors that influenced individual and team prioritization. It is of interest that participants ranked “perception of favourable impact of the activity or service” higher than “conclusive evidence” to support the activity or service. Perhaps it is time for pharmacy managers to examine and validate their perceptions of the value of various activities and services, if they really want to claim that pharmacy is an evidence-based profession. The 3 most important factors in this prioritization exercise were similar for individual and team rankings: “perception of favourable impact of activity or service on safe provision of health care”, “perception of favourable impact of activity or service on health outcomes”, and “conclusive evidence available to support decisions”. However, some factors, such as “required to address audits or inspections”, were ranked low by individuals (rank 12) but were ranked higher by the teams (rank 5). Conversely, “favourable departmental dynamics” was ranked high by individuals (rank 5) but low by teams (rank 14).
The correlations between individual and team rankings varied greatly, with the correlation coefficient ranging from 0.909 ( p < 0.001) for Team E to 0.215 ( p = 0.42) for Team D. This probably reflects the level of influence that the appointed leader for each team had on the ranking. A negative relationship was found for team F (correlation coefficient of −0.521, p = 0.039), which points to a strong leader with a very different ranking than the individual rankings of his team members.
This simulation exercise had several limitations. Participants were given a limited period of time (30 minutes) to make their decisions, and the simulation was conducted in the evening, after dinner. Limited instructions were given about the nature of the simulated hospital, its programs of care, and its workload volumes. Participants were asked to rank all 16 specified factors, although some respondents indicated verbally that they considered some of the factors to have had no influence on their prioritization decisions. The selection of pharmaceutical activities and the breakdown of coverage were informed by the research team’s knowledge of hospital pharmacy practice, but these choices were nonetheless somewhat arbitrary and undoubtedly open to debate. The extent of coverage within a domain was not calculated. While the results of this simulation exercise describe the priorities of a specific group of pharmacy leaders in Canada, no demographic data were captured to describe the sample of pharmacy leaders who participated; as such, generalization to all Canadian pharmacy leaders is not possible.
This study demonstrated use of a simulation exercise to examine how hospital pharmacy managers make prioritization decisions. The results of this simulation support the observation that pharmacy leaders do not agree on a core set of pharmaceutical activities that should have priority. Most of the 8 teams involved in the simulation opted to provide a wide range of services, but at a low level of comprehensiveness.
1
Pearson GJ. Evolution in the practice of pharmacy—not a revolution!
CMAJ
2007;176(9):1295–1296.


2
Holland RW, Nimmo CM. Transitions, part 1: Beyond pharmaceutical care.
Am J Health Syst Pharm
1999;56(17):1758–1764.
3
Abramowitz PW. The evolution and metamorphosis of the pharmacy practice model.
Am J Health Syst Pharm
2009;66(16):1437–1446.

4
Bond CA, Raehl CL. Clinical pharmacy services, pharmacy staffing, and hospital mortality rates.
Pharmacotherapy
2007;27(4):481–493.

5
Pickard AS, Hung SY. An update on evidence of clinical pharmacy services’ impact on health-related quality of life.
Ann Pharmacother
2006;40(9): 1623–1634.

6
Kaboli PJ, Hoth AB, McClimon BJ, Schnipper JL. Clinical pharmacists and inpatient medical care: a systematic review.
Arch Intern Med
2006; 166(9):955–964.

7
Chisholm-Burns MA, Graff Zivin JS, Lee JK, Spivey CA, Slack M, Herrier RN, et al. Economic effects of pharmacists on health outcomes in the United States: a systematic review.
Am J Health Syst Pharm
2010;67(19):1624–1634.

8
Ellitt GR, Brien JA, Aslani P, Chen TF. Quality patient care and pharmacists’ role in its continuity—a systematic review.
Ann Pharmacother
2009; 43(4):677–691.

9 Bussières JF. Clinical pharmacy services. In: Babich M, Bornstein C, Bussières JF, Hall K, Harding J, Lefebvre P, et al., editors. Hospital pharmacy in Canada 2009/2010 report . Eli Lilly; 2010 [cited 2011 Oct 7]. p. 3–20. Available from: www.lillyhospitalsurvey.ca/hpc2/content/2010_report/chapter_b%20.pdf
Canadian Journal of Hospital Pharmacy , VOLUME 65 , NUMBER 2 , March-April 2012