Régis Vaillancourt, Christina Khoury, Annie PouliotABSTRACT
Background
Medication preparation and administration are higher-risk steps in the medication management process. Therefore, medication management strategies, such as warnings and education about medication safety, are essential in preventing errors and improving the safe handling of medications by health care workers.
Objectives
To validate comprehension of 9 pictograms designed to improve medication safety, and to assess long-term recall of these pictograms in a sample of pharmacy students.
Methods
First- and second-year pharmacy students were recruited as participants. The study was divided into 2 phases: comprehension (Phase 1) and long-term recall (Phase 2). In Phase 1, a slideshow of the 9 pictograms was presented to participants, who were asked to write the meaning of and required action for each pictogram. The intended meaning of each pictogram was then presented to the participants. Four weeks later, long-term recall was assessed in Phase 2 of the study using the same method. The meaning and required action that participants provided for each pictogram were reviewed by 3 independent raters. A pictogram was considered to be validated in the pharmacy student population if at least 67% of participants identified the correct meaning or required action during the recall phase.
Results
A total of 101 pharmacy students participated in Phase 1 and 67 in Phase 2. In Phase 1, 4 pictograms met the 67% threshold for comprehension. In Phase 2, after training, 7 of the 9 pictograms were validated.
Conclusions
Given the results obtained with pharmacy students, redesign may be necessary for 2 of the pictograms. The use of validated medication safety pictograms on medication labels and other identifiers may prevent errors during medication handling and administration; this is an important avenue of investigation for future studies.
KEYWORDS: pictograms, medication safety, safe medication handling
RÉSUMÉ
Contexte
La préparation et l’administration des médicaments sont des étapes à risque plus élevé dans le processus de gestion des médicaments. Or, les stratégies de gestion des médicaments, dont les mises en garde et les informations sur la sécurité des médicaments, sont essentielles à la prévention des erreurs et à une manipulation plus sécuritaire des médicaments par les travailleurs de la santé.
Objectifs
Valider la compréhension de neuf pictogrammes conçus pour accroître la sécurité des médicaments et vérifier si ces pictogrammes s’inscrivent dans la mémoire à long terme des étudiants en pharmacie.
Méthodes
On a recruté des participants auprès des étudiants de première et de deuxième année en pharmacie. L’étude était composée de deux phases : compréhension (phase 1) et mémoire à long terme (phase 2). Dans la phase 1, un diaporama de neuf pictogrammes a été présenté aux participants à qui l’on a demandé d’interpréter chaque pictogramme et la mesure qu’il impose. On a ensuite présenté aux participants la signification qu’on voulait donner à chaque pictogramme. Quatre semaines plus tard durant la phase 2, un test de mémoire à long terme employant la méthode de la phase 1 a été effectué. Les réponses des participants quant à la signification et à la mesure à prendre pour chaque pictogramme ont été analysées par trois évaluateurs indépendants. Un pictogramme était considéré comme validé dans la population des étudiants en pharmacie si un minimum de 67 % des participants se souvenait de la signification adéquate et de la mesure à prendre recherchée pendant la phase de test de mémoire à long terme.
Résultats
Au total, 101 étudiants en pharmacie ont participé à la phase 1 et 67 à la phase 2. Dans la phase 1, quatre pictogrammes ont atteint le seuil de 67 % pour la compréhension. Dans la phase 2, après une formation, 7 pictogrammes sur 9 ont été validés.
Conclusions
Compte tenu des résultats obtenus auprès des étudiants en pharmacie, deux des pictogrammes pourraient être appelés à retourner à la planche à dessin. L’ajout de pictogrammes validés de sécurité des médicaments sur les étiquettes et autres marques d’identification de médicaments pourrait éviter des erreurs pendant la manipulation et l’administration de médicaments. Il s’agit là d’une piste de recherche importante pour de futures études.
MOTS CLÉS: pictogrammes, sécurité des médicaments, manipulation sécuritaire des médicaments
The medication management process includes prescribing, transcribing, dispensing, and administering medication. When there is a breakdown or oversight during any of these steps, a medication error may occur, exposing the patient to harm.1,2 Evidence shows that the leading sources of medication errors are the prescribing and administration steps, with administration representing more than half of all errors.1,3–5 Medication administration is a complex process that encompasses counting, calculating, mixing, measuring, and ensuring that the right patient receives the right medication, in the right dose, by the right route, for the right reason, at the right time.1,6 Medication routes such as IV administration are associated with the highest frequencies of errors, with some studies reporting error rates as high as 50%.1,7 At particular risk of medication errors is the pediatric population. Medication error rates up to 20% have been reported for the pediatric population, or 3 times higher than in the adult population.4,8
Visual aids can help draw attention to a document and improve the comprehension of information.9 Pictograms are visual aids that represent concepts through visual synthesis to communicate messages and information.10 They are intended to provide information in an effective manner without the use of words and therefore can prove advantageous in settings with language or literacy challenges.10,11 The Dual Coding Theory was proposed in 1971 by Canadian psychology professor Allan Paivio. The Dual Coding Theory posits that verbal and nonverbal information are stored in long-term memory as 2 distinct systems, whereby activation of one of the systems can trigger activation of the other.12 It has also been suggested that there is improved recall of information when pictures are presented instead of words, through activation of both coding systems.13 Improved recall of information from pictures, as opposed to words alone, is known as the “pictorial superiority effect”.12 The Dual Coding Theory proposes that pictograms, with associated text, could provide optimal processing and improve recall of medication information. A few studies have shown the superiority of pictograms used in conjunction with verbal communication,14–19 whereas other studies have failed to demonstrate that pictograms improve long-term recall of instructions.17,20 However, in recent years, health care systems have recognized the value of pictograms, and studies are showing improved comprehension, recall, and adherence with use of pictograms among patients receiving prescribed medications.2,21
The use of pictograms is increasingly being recommended to convey warnings and safety information; indeed it is common to find warning signs and labels on consumer products.11,22,23 The Workplace Hazardous Materials Information System has implemented cautionary pictograms from the Globally Harmonized System of Classification and Labelling of Chemicals to increase workplace safety in the handling of chemicals.24 Similar strategies for medication handling could improve medication safety, particularly the medication administration process. Furthermore, these pictograms would align with the Basel Statements put forward by the International Pharmaceutical Federation (FIP), including the statement that “Hospital pharmacists should ensure that medicines are packaged and labeled to ensure identification and to maintain integrity until immediately prior to administration to the individual patient”.25 The FIP also recommends that hospitals develop and implement policies and practices to prevent errors associated with the route of administration.25
In an initial, recently conducted study, our team identified 9 key medication safety issues that could benefit from the implementation of safety pictograms for health care providers.2 Pictograms were then developed to represent each of these safety issues and underwent an iterative design process. A Delphi survey with self-declared experts from the FIP was conducted to identify international preferences for the pictograms to represent these 9 key medication safety issues (published elsewhere in this issue).26 For these pictograms to be implemented in practice, not only must they be designed with input from members of the target population, but they must also undergo validation by members of the target population. In this case, the target population consists of health care professionals, such as pharmacy technicians, pharmacists, nurses, and physicians. As a first step in this validation process, a sample of pharmacy students was recruited for the current pilot study, for initial validation of comprehension and recall of the 9 pictograms designed to improve medication safety.
Students from the School of Pharmacy of the University of Waterloo, Waterloo, Ontario, were invited to participate in the study. Students were recruited between May and July 2017 from 2 classes of first- and second-year students in the pharmacy program. The demographic data collected from participants were age, year of study, and whether they had previous experience in the hospital setting. There were no benefits or risks associated with participating in the study, and written consent was obtained from each participant. This study was approved by the Children’s Hospital of Eastern Ontario Research Ethics Board and the Research Ethics Board at the University of Waterloo.
Comprehension was assessed during regularly scheduled classes at the School of Pharmacy. A slide show was presented to participants, with the 9 pictograms presented sequentially. After each pictogram was presented, participants were asked to record their responses to the following 3 questions on a paper questionnaire: What do you think this symbol means? In the context of health care professionals prescribing, preparing, dispensing, or administering a medication with this symbol on it, what action should you take in response to this symbol? How could this pictogram be improved? The same 3 questions were asked for each of the 9 pictograms presented. Once the comprehension test was completed, the pictograms were displayed again and the intended meaning was explained to participants.
To avoid research team bias, 3 independent raters evaluated participants’ responses. Answers were scored as “correct”, “incorrect”, or “no response is given”. A response was rated as correct if a correct answer was provided for either the first question or the second question, which were considered together as prompts to elicit the meaning of the pictogram. The percentage of participants who understood the pictograms was calculated using only the “correct” and “incorrect” responses for each pictogram. In accordance with ISO standard 9186 from the International Organization for Standardization (ISO), a comprehension rate of at least 67% was needed for a pictogram to be considered validated.27 The ISO standards were chosen because they are international and directly applicable to the design of pharmaceutical pictograms.11 Participants’ comments on pictogram improvement were considered only for those pictograms that did not meet this validation standard.
Long-term recall of pictogram meaning was assessed after 4 weeks. The same slide-show method was used, and the same questions were asked as in Phase 1.
Differences in comprehension rates for between-subject comparisons (e.g., first-year students compared with second-year students) were assessed using the Fisher exact test with α set at 0.05. Differences in comprehension rates for within-subject comparisons (i.e., comprehension compared with recall) were assessed using the McNemar test for paired dichotomous data.
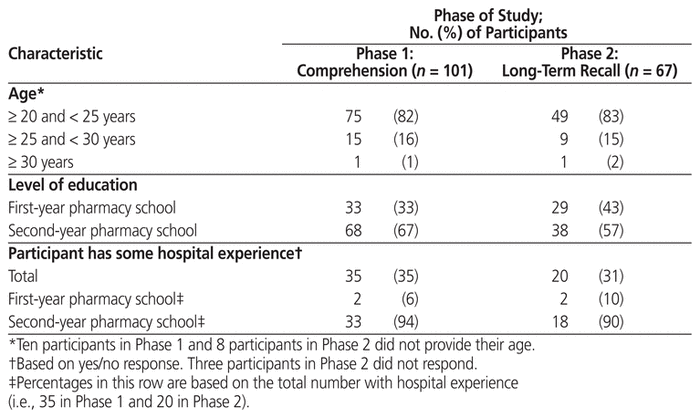
In Phase 1 of the study, 101 students participated. In Phase 2 of the study, 67 students completed the recall assessment. Demographic information for these participants is presented in Table 1.
Table 1 Demographic Characteristics of Study Participants
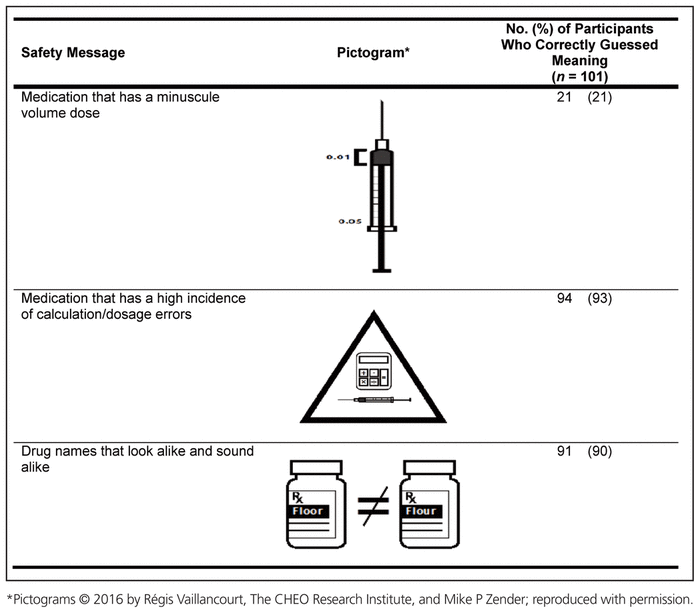
Four of the pictograms were understood by more than 67% of participants. These pictograms represented “Drug that requires airway management before administration”, “Drug that must always be diluted before administration”, “Medication that has a high incidence of calculation/dosage errors”, and “Drug names that look alike and sound alike”. The remaining 5 pictograms were each understood by less than 67% of participants (Table 2).
Table 2 Pictogram Comprehension (Phase 1)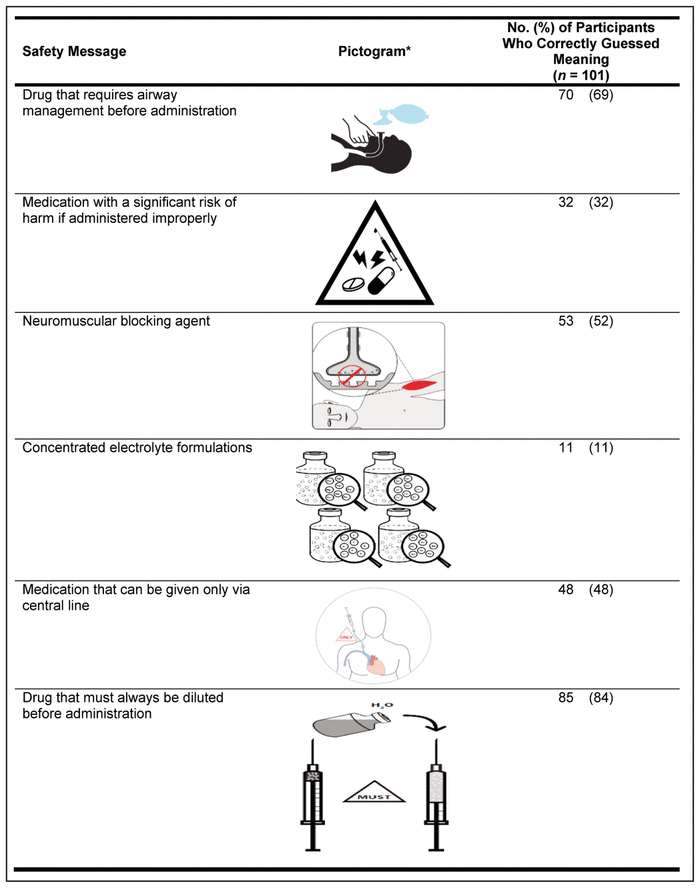
A subgroup analysis was performed according to participants’ year of study (see Appendix 1, available at https://www.cjhp-online.ca/index.php/cjhp/issue/view/177/showToc). Comprehension rates were compared between the 33 first-year students and the 68 second-year pharmacy students. Despite having more education in the field of pharmacy, second-year students were no more likely to understand the pictograms, with one exception: second-year students were more likely to understand the pictogram for “Drug that must always be diluted before administration” (22/33 [67%] for first-year students versus 63/68 [93%] for second-year students, p = 0.002 by Fisher exact test).
Another subgroup analysis was performed to examine whether pharmacy students with hospital experience were more likely than those without such experience to understand the pictograms (see Appendix 2, available at https://www.cjhp-online.ca/index.php/cjhp/issue/view/177/showToc). Among the participants who completed the demographic questions, 35 had prior hospital experience and 62 did not. Participants with hospital experience were no more likely to understand the pictograms, with one exception. The participants with hospital experience were more likely than those without to understand the pictogram for “Drug that requires airway management before administration” (29/35 [83%] for those with experience versus 37/62 [60%] for those without experience, p = 0.024 by Fisher exact test).
A total of 67 participants from the first phase of the study completed the second phase. For each pictogram, comprehension and recall rates for participants who completed both Phases 1 and 2 are presented in Table 3. At recall, 7 of the 9 pictograms reached the ISO standard of at least 67% comprehension, with only “Concentrated electrolyte formulations” (37/67 [55%]) and “Medication with a significant risk of harm if administered improperly” (41/67 [61%]) not reaching the minimum threshold for comprehension. All but 2 of the pictograms were understood by more participants during Phase 2 than Phase 1. The 2 pictograms without a statistically significant increase in understanding were “Drug that requires airway management before administration” (47/67 [70%] in Phase 1 versus 53/67 [79%] in Phase 2; p = 0.31) and “Medication that has a high incidence of calculation/dosage errors” (61/67 [91%] in Phase 1 versus 66/67 [99%] in Phase 2; p = 0.06 by Fisher exact test). In both cases, the pictograms were relatively well understood in Phase 1, leaving less room for improvement in comprehension after training.
Table 3 Comprehension (Phase 1) and Recall (Phase 2) for Subset of Participants Who Completed Both Phases of Study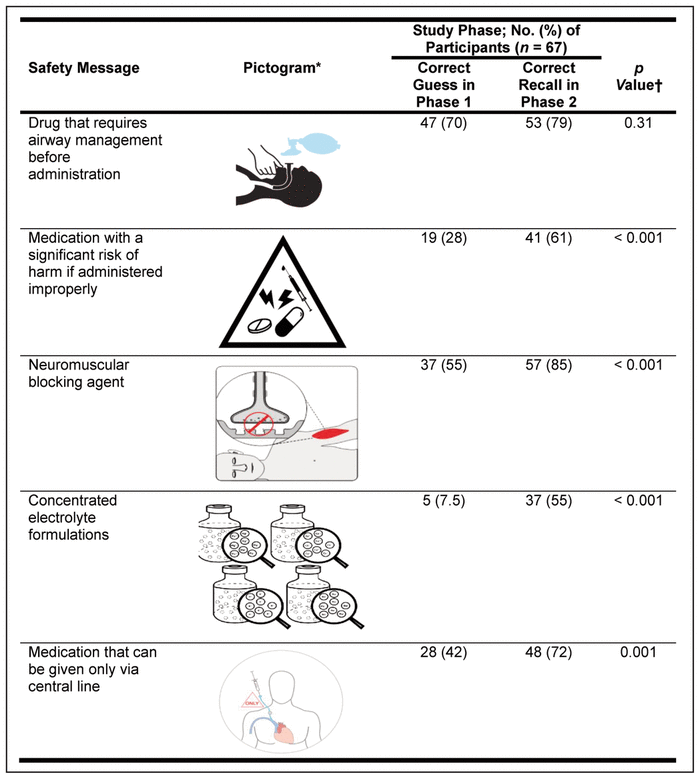
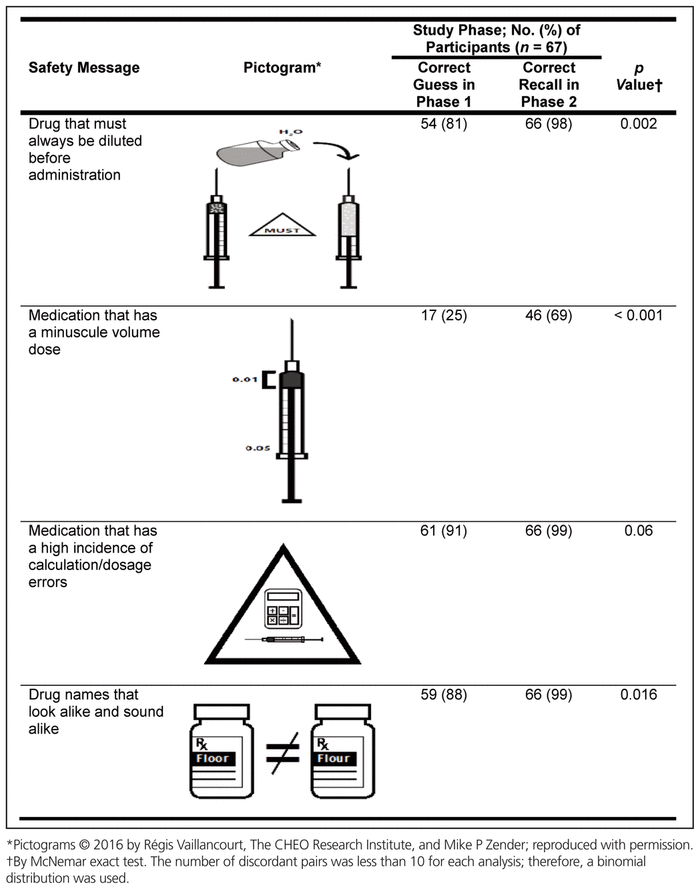
Subgroup analyses were performed to examine the influence of year of study and prior hospital experience on the comprehension of the pictograms at recall. Overall, 29 first-year students and 38 second-year students participated in the long-term recall comprehension test. No statistically significant differences were found in rates of comprehension between first- and second-year students. Students without prior hospital experience were less likely to recall the pictogram for “Medication that can only be given via central line” than were students who did have prior hospital experience (28/44 [64%] among those without prior experience versus 18/20 [90%] among those with prior experience; p = 0.026 by Fisher exact test). No other statistically significant differences were found.
Pharmaceutical pictogram development involves a step-wise approach that must follow standardized processes.11,27 Development begins with identifying and understanding a specific population’s needs.11,28 This step was accomplished in a prior study by identifying the 9 key medication safety issues that could benefit from implementation of safety pictograms.2 In the current study, we started the validation process by piloting the pictograms with a sample of pharmacy students. As health care workers in training, these students lack the experience of professionals, but given their education so far, they can represent a starting point for validation. The first phase of the study showed that participants could correctly guess the meaning of only 4 of the 9 pictograms designed to improve medication safety. At recall, 4 weeks later, at least 67% of participants were able to correctly recall the meaning of 7 of the 9 pictograms, thus reaching the standard set by the ISO.27 Hence, this study supports the idea that training on the meaning of pictograms can increase comprehension of more complex messages. Long-term recall was intentionally chosen as the primary outcome because of the complexity of the safety messages depicted in the 9 pictograms. Recall is the process of retrieving individual words or picture elements from memory and is closely related to comprehension, the process of interpreting the meaning of words or pictures to understand their collective meaning.9
The pictograms depicting “Concentrated electrolyte formulations” and “Medication with a significant risk of harm if administered improperly” did not reach the ISO threshold for validation in this study, even though there was a statistically significant increase in the rate of comprehension at recall. In relation to the first of these pictograms, it is possible that the students, who were in their first or second year of study, had not yet received instruction on many topics related to the use and significance of electrolyte solutions. Even though the meaning of the pictogram was explained, supporting information about the harms associated with concentrated electrolyte solutions and the effect on patient outcomes was not provided. Health care workers or more senior pharmacy students may be more likely to understand this pictogram. Participant feedback was collected during the study for those pictograms that were not validated. Participants suggested changing and redesigning the pictogram for “Medication with a significant risk of harm if administered improperly” because they found that the thunderbolts confused the message. Participants also suggested that including words within the pictogram would help to elucidate its meaning. Future studies should target practising health care workers for validation of these pictograms. We will continue to consult health care workers to gather additional comments on how these pictograms can be improved.
Although the study sample approximates, in some ways, the target population, it is difficult to draw firm conclusions concerning the low rates of comprehension for 5 of the 9 pictograms in Phase 1. It is impossible to know, without further validation in a sample of health care workers, whether the problem lies with the pictograms themselves, or whether the pharmacy students participating in the study simply were not yet knowledgeable enough concerning all aspects of medication safety to identify the pictograms’ meaning. The fact that study participants were more likely to understand the pictograms after training suggests that health care workers likely would be able to identify the meaning of the pictograms, because they would already be well educated about all aspects of medication safety and would have encountered these medication safety issues in practice. Validation of these pictograms in health care professionals must be the next step.
Implementation of medication safety programs has the potential to save health care systems substantial costs and to prevent serious patient injury, thereby leading to better patient outcomes.29 In this study, we assessed the comprehensibility of 9 pictograms developed to increase medication safety through interception and prevention of medication administration errors. Further studies will be needed to validate the pictograms in a sample of health care professionals and possibly to redesign and validate the pictograms depicting “Concentrated electrolyte formulations” and “Medication with a significant risk of harm if administered improperly”. It will be important to determine how these pictograms can be simplified or how the messages themselves could be clarified to represent the same ideas. Future studies will focus on the impact of the 9 pictograms in preventing medication administration errors in a health care setting and in improving clinical outcomes.
1 Krähenbühl-Melcher A, Schlienger R, Lampert M, Haschke M, Drewe J, Krähenbühl S. Drug-related problems in hospitals: a review of the recent literature. Drug Saf. 2007;30(5):379–407.

2 Vaillancourt R, Pouliot A, Streitenberger K, Hyland S, Thabet P. Pictograms for safer medication management by health care workers. Can J Hosp Pharm. 2016;69(4):286–93.

3 Dean B, Schachter M, Vincent C, Barber N. Prescribing errors in hospital inpatients: their incidence and clinical significance. Qual Saf Health Care. 2002;11(4):340–4.


4 Ghaleb MA, Barber N, Franklin BD, Wong ICK. The incidence and nature of prescribing and medication administration errors in paediatric inpatients. Arch Dis Child. 2010;95(2):113–8.

5 Ehrmann O. Les erreurs médicamenteuse en pédiatrie hospitalière [dissertation]. Lyon (France): Université de Lyon; 2012.
6 Lapkin S, Levett-Jones T, Chenoweth L, Johnson M. The effectiveness of interventions designed to reduce medication administration errors: a synthesis of findings from systematic reviews. J Nurs Manag. 2016;24(7):845–58.

7 Taxis K, Barber N. Ethnographic study of incidence and severity of intravenous drug errors. BMJ. 2003;326(7391):684.


8 Kaushal R, Bates DW, Landrigan C, McKenna KJ, Clapp MD, Federico F, et al. Medication errors and adverse drug events in pediatric inpatients. JAMA. 2001;285(16):2114–20.

9 Houts PS, Doak CC, Doak LG, Loscalzo MJ. The role of pictures in improving health communication: a review of research on attention, comprehension, recall, and adherence. Patient Educ Couns. 2006;61(2):173–90.
10 Spinillo CG. Graphic and cultural aspects of pictograms: an information ergonomics viewpoint. Work. 2012;41 Suppl 1:3398–403.
11 Montagne M. Pharmaceutical pictograms: a model for development and testing for comprehension and utility. Res Soc Adm Pharm. 2013;9(5):609–20.
12 Paivio A, Rogers TB, Smythe PC. Why are pictures easier to recall than words? Psychon Sci. 1968;11(4):137–8.
13 Sadoski M, Paivio A. Imagery and text: a dual coding theory of reading and writing. New York (NY): Routledge; 2013.
14 Young J, Kothiyal P. A pilot study to evaluate pharmaceutical pictograms in a multispecialty hospital at Dehradun. J Young Pharm. 2011;3(2):163–6.
15 Houts PS, Bachrach R, Witmer JT, Tringali CA, Bucher JA, Localio RA. Using pictographs to enhance recall of spoken medical instructions. Patient Educ Couns. 1998;35(2):83–8.
16 Morrell RW, Park DC, Poon LW. Effects of labeling techniques on memory and comprehension of prescription information in young and old adults. J Gerontol. 1990;45(4):P166–72.

17 Houts PS, Witmer JT, Egeth HE, Loscalzo MJ, Zabora JR. Using pictographs to enhance recall of spoken medical instructions II. Patient Educ Couns. 2001;43(3):231–42.

18 Wilby K, Marra CA, da Silva JH, Grubisic M, Harvard S, Lynd LD. Randomized controlled trial evaluating pictogram augmentation of HIV medication information. Ann Pharmacother. 2011;45(11):1378–83.

19 Sorfleet C, Vaillancourt R, Groves S, Dawson J. Design, development and evaluation of pictographic instructions for medications used during humanitarian missions. Can Pharm J. 2009;142(2):82–8.
20 Thompson AE, Goldszmidt MA, Schwartz AJ, Bashook PG. A randomized trial of pictorial versus prose-based medication information pamphlets. Patient Educ Couns. 2010;78(3):389–93.

21 Pascuet E, Dawson J, Vaillancourt R. A picture worth a thousand words: the use of pictograms for medication labelling. Int Pharm J. 2008;23(1):1–4.
22 Sojourner RJ, Wogalter MS. The influence of pictorials on evaluations of prescription medication instructions. Ther Innov Regul Sci. 1997; 31(3):963–72.
23 Mansoor LE, Dowse R. Design and evaluation of a new pharmaceutical pictogram sequence to convey medicine usage. Ergon SA. 2004;16(2):29–41.
24 WHMIS pictograms 2015. Hamilton (ON): Canadian Centre for Occupational Health and Safety; 2015.
25 Revised FIP Basel Statements on the future of hospital pharmacy. Geneva (Switzerland); International Pharmaceutical Federation; 2014 [cited 2018 Jul 19]. Available from: https://fip.org/files/fip/FIP_BASEL_STATEMENTS_ON_THE_FUTURE_OF_HOSPITAL_PHARMACY_2015.pdf
26 Vaillancourt R, Zender MP, Coulon L, Pouliot A. Development of pictograms to enhance medication safety practices of health care workers and international preferences. Can J Hosp Pharm. 2018;71(4):243–57.
27 Technical Committee, Graphical Symbols (ISO/TC 145). ISO 9186-1:2014. Graphical symbols -- test methods -- part 1: method for testing comprehensibility.. Geneva (Switzerland): International Organization for Standardization; 2014.
28 van Beusekom MM, Land-Zandstra AM, Bos MJW, van den Broek JM, Guchelaar HJ. Pharmaceutical pictograms for low-literate patients: understanding, risk of false confidence, and evidence-based design strategies. Patient Educ Couns. 2017;100(5):966–73.

29 Rash-Foanio C, Galanter W, Bryson M, Falck S, Liu KL, Schiff GD, et al. Automated detection of look-alike/sound-alike medication errors. Am J Health Syst Pharm. 2017;74(7):5217.
Competing interests: None declared. ( Return to Text )
Funding: This study was funded by Medbuy. ( Return to Text )
The authors acknowledge participation and support from Dr Dave Edwards, Hallman Director and Professor at the School of Pharmacy, University of Waterloo, for facilitating the research ethics board approval process and for providing feedback on the manuscript.
Canadian Journal of Hospital Pharmacy, VOLUME 71, NUMBER 4, July-August 2018