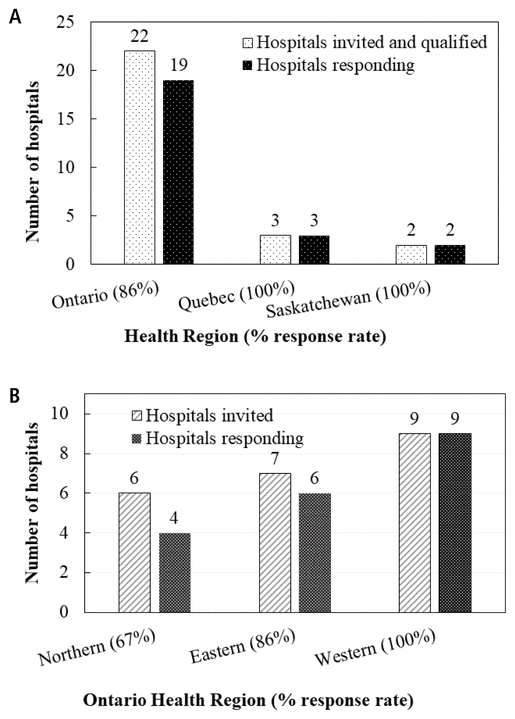
FIGURE 1 Response to the survey by province (A) and by Ontario health region (B).
Paula Newman, Sammu Dhaliwall, Olena Polyakova, Kevin McDonaldABSTRACT
Background
The Canadian Society of Hospital Pharmacists’ Hospital Pharmacy in Canada Report presents data from pharmacy departments that service hospitals with at least 50 acute care beds. This report provides valuable data on pharmacy distribution, clinical, and management services in relation to hospital size, type, and geographic region. Pharmacy and hospital leadership use these extensive data in identifying baseline, benchmarking current, and planning enhanced pharmacy services. However, for most of Canada’s small hospitals, such data remain unknown, and leadership remains uninformed.
Objective
To gather and analyze data about current pharmacy distribution, clinical, and management services in hospitals with fewer than 50 acute care beds receiving third-party remote pharmacy (telepharmacy) services.
Methods
In April 2019, pharmacy administrators of hospitals in Ontario, Quebec, and Saskatchewan that had fewer than 50 acute care beds and were using third-party telepharmacy services were invited to complete a comprehensive survey addressing concepts similar to those in the Hospital Pharmacy in Canada Survey. The following data on clinical pharmacy practice were collected: models of care, assignments to patient care programs, pharmacists’ activities, performance indicators, and professional evaluation. The description of pharmacy distribution services comprised type of system, technology, location, hours of operation, method of medication order entry and verification, and medication administration records. Details on facilities’ parenteral admixture infrastructure, policy for and provision of sterile compounding, and pharmacy department human resources, including composition and staffing ratios, were also collected.
Results
Of the 27 hospitals in Ontario, Quebec, and Saskatchewan that were invited to participate, 24 (89%) completed the survey. The median facility size was 19 acute care beds.
Conclusions
Previously unavailable in Canada, these quantitative data from small hospitals supported by telepharmacy services provide facts about pharmacy distribution, clinical, and management services to inform hospital and pharmacy leaders. Creation of a survey unique to small hospitals, whether or not they use telepharmacy services, could provide a valuable resource to assist in the benchmarking, planning, and enhancement of pharmacy services in remote and rural communities.
KEYWORDS: small hospital, telepharmacy, pharmacy practice, remote, rural, survey
RÉSUMÉ
Contexte
Le Rapport sur les pharmacies hospitalières canadiennes de la Société canadienne des pharmaciens d’hôpitaux expose les données provenant des services de pharmacie qui appuient les hôpitaux comptant au moins 50 lits de soins aigus. Il offre de précieuses données sur les services de distribution des médicaments, les services cliniques et de gestion en relation avec la taille, le type et la région géographique des hôpitaux. Les équipes de direction des pharmacies et des hôpitaux utilisent ces données exhaustives pour déterminer une base de référence, évaluer les services de pharmacie actuels et planifier l’amélioration des services. Cependant, la plupart des petits hôpitaux du Canada ne disposent pas de ce type de données, et les équipes de direction n’en sont pas informées.
Objectif
Réunir et analyser des données sur la distribution de médicaments, les services cliniques et la gestion des services pharmaceutiques actuels dans les hôpitaux comptant moins de 50 lits de soins aigus, qui reçoivent des services de pharmacie à distance (services de télépharmacie) fournis par des tiers.
Méthode
En avril 2019, les administrateurs de pharmacie d’hôpitaux en Ontario, au Québec et en Saskatchewan remplissant ces critères ont été invités à répondre à une enquête exhaustive abordant des concepts similaires à ceux de Sondage sur les pharmacies hospitalières canadiennes. Les données suivantes sur la pratique de la pharmacie clinique ont été recueillies: modèles de soins, affectation des pharmaciens à des programmes particuliers de soins des patients, activités des pharmaciens, indicateurs de performance et évaluation professionnelle. La description des systèmes de distribution des médicaments par les pharmacies comprenait: le type de système, la technologie, le lieu, les heures de service, le mode de saisie et de vérification des ordonnances de médicaments ainsi que les dossiers d’administration. Les détails concernant l’infrastructure pour l’administration de solutions parentérales, la politique relative aux composés stériles et à leur distribution ainsi que les ressources humaines des services de pharmacie, y compris la composition et les ratios en personnel, ont également été recueillis.
Résultats
Sur les 27 hôpitaux en Ontario, au Québec et en Saskatchewan invités à participer à l’enquête, 24 (89 %) y ont répondu. La taille moyenne des installations était de 19 lits de soins aigus.
Conclusions
Autrefois indisponibles au Canada, ces données quantitatives provenant de petits hôpitaux soutenus par des services de télépharmacie livrent des faits concernant le système de distribution des médicaments au sein des pharmacies, les services cliniques et de gestion, qui permettent de guider les cadres des hôpitaux et de la pharmacie. La création d’une enquête unique destinée aux petits hôpitaux, utilisant ou non des services de télépharmacie, pourrait constituer une précieuse ressource pour aider à évaluer, à planifier et à améliorer les services pharmaceutiques dans les communautés rurales et éloignées.
MOTS CLÉS: petit hôpital, télépharmacie, pratique de la pharmacie, éloigné, rural, enquête
The health care delivery system in Canada continually aims to improve in response to community needs. The provision of high-quality, cost-effective health care is of paramount importance for every clinical service in the country. Pharmacists play a significant role in patient care, contributing to treatment goals by addressing medication- and disease-related issues, optimizing medication management, providing education to patients and other health care providers, and addressing gaps in patient care. Pharmacy practice in Canada is guided by legislation, codes of ethics, and professional regulatory authorities such as Accreditation Canada, which govern minimum standards.1 In addition, several organizations encourage and promote excellence in hospital pharmacy, including the Canadian Society of Hospital Pharmacists (CSHP), the International Pharmaceutical Federation, and the Canadian Pharmacists Association. The CSHP’s vision is to lead and inspire excellent pharmacy practice integral to patient-centred care in hospitals and other collaborative health care settings, and it continuously assesses the progress of pharmacy services in Canadian hospitals in achieving such excellence. The Hospital Pharmacy in Canada Report (referred to hereafter as “the Report”), based on a nationwide survey, has been published every 3 to 4 years since 1986.2 With the 2016/17 (21st) edition, the survey and resulting publication were, for the first time, conducted under the auspices of the CSHP Hospital Pharmacy in Canada Survey Board, which now operates as an affiliated board of the CSHP. The Report is the culmination of an extensive analysis of data gathered via an online survey of leadership of pharmacy departments across Canada. It has been of substantial value to Canadian hospital pharmacy leadership for sharing information on distribution, clinical, and management services and practices within their health care facilities. The most recent Hospital Pharmacy in Canada Survey, conducted in spring 2017, had a high response rate: 180 (83%) of eligible hospitals, with eligibility based on the criterion of 50 or more acute care beds, participated.3,4 Quantitative data sought included information about pharmacy distribution, clinical, and management services, hospital programs and services, pharmacy human resources, and technology in relation to hospital size, type, and geographic region. Today, pharmacy and hospital leaders use these data to identify baseline values, to benchmark current pharmacy services, workload, and resources, and to assist leaders in the planning and expansion of pharmacy services, with the overall goals of improving patient care, optimizing health outcomes, and reducing health care costs. The American Society of Health-System Pharmacists (ASHP) conducts national surveys of pharmacy services in hospital settings in the United States, to describe practices and technologies used to manage and improve medication systems. The ASHP survey is open to all hospitals, including those with fewer than 50 acute care beds.5–7
The Canadian Institute for Health Information reported that Canada had 591 hospitals (acute to long-term care) in 2017/18.8 However, up to 62% of Canadian institutions, including small hospitals (fewer than 50 acute care beds) are not represented in the Hospital Pharmacy in Canada Report. As the role of pharmacists in direct patient care continues to increase, we believe that assessing the current state of pharmacy services and the resources available to small hospitals is necessary to deliver best pharmacy practices and equitable care for all Canadians, regardless of the location and size of their hospital; such assessments form a cornerstone of Canada’s universal health care policies. Although pharmacy services in small hospitals have been assessed in the United States, to date the data required to provide the highest-quality cost-effective pharmacy services for patients receiving care in small Canadian health care institutions, often located in remote and rural communities, remain unknown. Given that the majority of institutions in Canada are small hospitals that may require a unique approach to assessment, an initial exploration of a subset of such hospitals may be appropriate. As the only third-party hospital telepharmacy provider in Canada, Northwest Telepharmacy Solutions uses a shared distribution, clinical, and management model to provide services to a broad range of Canadian hospitals that vary in size and extent of services, with and without on-site pharmacists. These factors and the ongoing relationship between small hospitals and the telepharmacy services offered by this company (the authors’ employer) presented an opportunity for the current study.
The aim of this study was to bridge the gap in the availability of comprehensive quantitative data on hospital pharmacy services supported in whole or in part by telepharmacy in small hospitals in Canada.
A comprehensive structured survey was developed to describe distribution, clinical, and management services and practices within small hospitals (< 50 acute care beds) in Canada and allow comparison with larger hospitals (≥ 50 acute care beds). This survey was based on the well-respected and well-utilized CSHP Hospital Pharmacy in Canada Report,3 with survey questions covering the same domains. This cross-sectional survey targeted leaders of pharmacy departments that service hospitals with fewer than 50 acute care beds supported, either fully or in part, by third-party telepharmacy services, in remote and rural communities representing certain provinces of Canada, with or without on-site pharmacists. Before the survey was distributed, contact information for pharmacy leadership was pre-established through the telepharmacy provider.
The criteria for inclusion were pharmacy departments providing services for hospitals (single-site or multiple-site) with fewer than 50 acute care beds in total, with pharmacy services supported, in whole or in part, by a telepharmacy provider. There were no exclusion criteria.
The survey was made available in the following formats: Microsoft Word, Adobe PDF, and online through a link to the SurveyMonkey platform. Before distribution, the survey was pretested, in all formats, by 2 pharmacists (P.N., S.D.) for accuracy, clarity, and functionality. The estimated time for completion of all sections (where applicable) was 45 minutes. The survey was available for 90 days.
In April 2019, eligible hospital pharmacy administrators were invited to participate in the survey via secure email. The survey introduction letter included an electronic copy of the most recent CSHP Hospital Pharmacy in Canada Report and a copy of the study survey in Microsoft Word and Adobe PDF formats, as well as an online link to the SurveyMonkey platform. Instructions detailing survey completion, deadlines, and contacts for support were also included. The complete survey content and instructions are available upon request to the corresponding author. For the minority of institutions that did not complete the survey by the requested deadline, an email reminder was sent 2 weeks after the first deadline to establish whether the site wished to participate. If an email response or survey was still not completed, a telephone call was made 2 weeks later. Telephone support for survey completion (i.e., data entry) was offered, primarily to reduce the time commitment required of pharmacist leaders responsible for managing more than one pharmacy department. No incentive was offered to participants, and participation was voluntary. Because the study did not involve living human participants or human biological materials, ethics approval was not sought.
The survey responses were aggregated and coded into a spreadsheet (Excel 2016 for Windows, Microsoft Corporation). Two researchers (P.N., O.P.), working independently, manually reviewed the survey responses for completeness before the analyses were performed. Descriptive statistics were used to analyze the prevalence of respondents’ choices, to characterize the scope of clinical pharmacy practice, pharmacy human resources, drug distribution systems, and technology. For analysis of each survey question, all submitted responses were used, and denominators were adjusted according to the number of respondents or the number of responses as appropriate. The Shapiro-Wilk normality test was performed for each applicable set of variables. The test rejected the normality assumption, and medians are therefore reported.
Staffing ratios per acute or total (acute and non-acute) patient-days were calculated. The numerator in these ratios is the number of hours of staff time that a pharmacy department was operating during a year (budgeted hours). The denominator was the number of acute or total patient-days, respectively. For purposes of staffing ratios, 1.0 full-time equivalent (FTE) was defined as 2080 hours per year.
Twenty-seven eligible facilities from Ontario, Quebec, and Saskatchewan were invited to participate in the survey, and there was an 89% (24/27) response rate (Figure 1). The baseline characteristics of participating hospitals are summarized in Table 1. Participating facilities had medians of 19 acute care beds and 14 non–acute care beds. For fiscal year 2018/19, the median occupancy rate was 77.1%, with median length of stay 6.2 days and a median of 8823 patient-days. Standard operating hours for the hospital pharmacies averaged 41.5 (standard deviation 12.7) hours per week. None of the study pharmacy departments was open for 168 hours/week (i.e., “24/7”).
|
|
||
|
FIGURE 1 Response to the survey by province (A) and by Ontario health region (B). |
||
TABLE 1 Characteristics of Participating Hospitals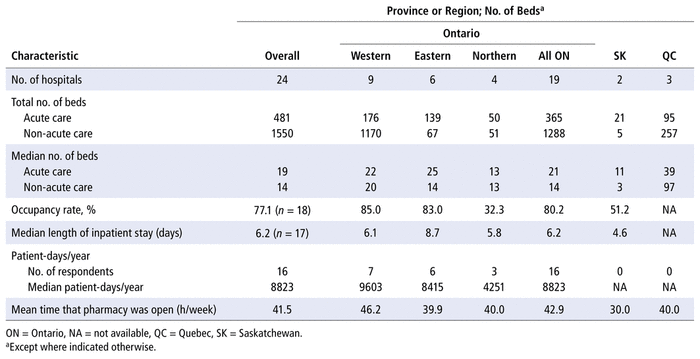
Of the formal hospital inpatient care programs listed in the survey, respondents reported a facility median of 4. Most hospitals reported the availability of a general medicine program (92%, 22/24), nearly half had a pain or palliative care program (46%, 11/24), and 33% (8/24) had a general surgery program (Table 2). Overall, 71% of respondents indicated that their facility had an assigned pharmacist (at least 0.2 FTE) for at least 1 inpatient practice area. All facilities with inpatient programs for infectious disease/AIDS/antimicrobial stewardship (n = 7), mental health (n = 3), neurology and/or stroke (n = 2), hematology and anticoagulation (n = 2), and hematology-oncology (n = 1) had a pharmacist assigned to these programs. Other programs having a high rate of clinical involvement by pharmacists included rehabilitation (83%, 5/6), general surgery (75%, 6/8), critical care (75%, 3/4), general medicine (73%, 16/22), and geriatrics (71%, 5/7).
TABLE 2 Profile of Pharmacist Assignment to Inpatient Programsa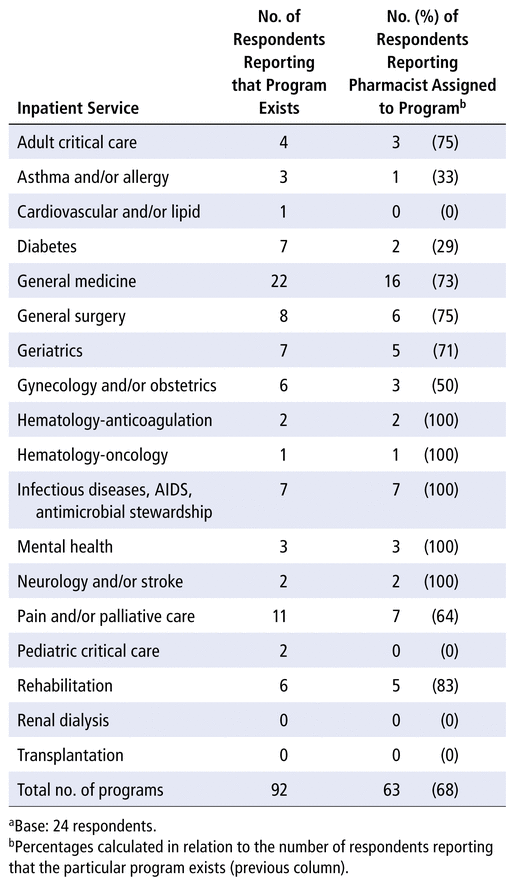
Seventy-nine percent (19/24) of facilities declared that they had at least 1 of the 17 outpatient programs listed in the survey, with a median of 1 outpatient program per facility. Forty-three percent (10/23) of respondents reported assignment of a designated pharmacist to at least 1 outpatient practice area. Emergency was the most common outpatient service, and 38% of facilities (5/13) reported pharmacist involvement. Hospitals reporting the following outpatient programs all had a pharmacist assignment: hematology (n = 1), diabetes (n = 1), general surgery (n = 1), and rehabilitation (n = 1) (Table 3). Although an outpatient geriatrics program was present in 6 facilities, none of these had a pharmacist assigned.
TABLE 3 Profile of Pharmacist Assignment to Outpatient Programsa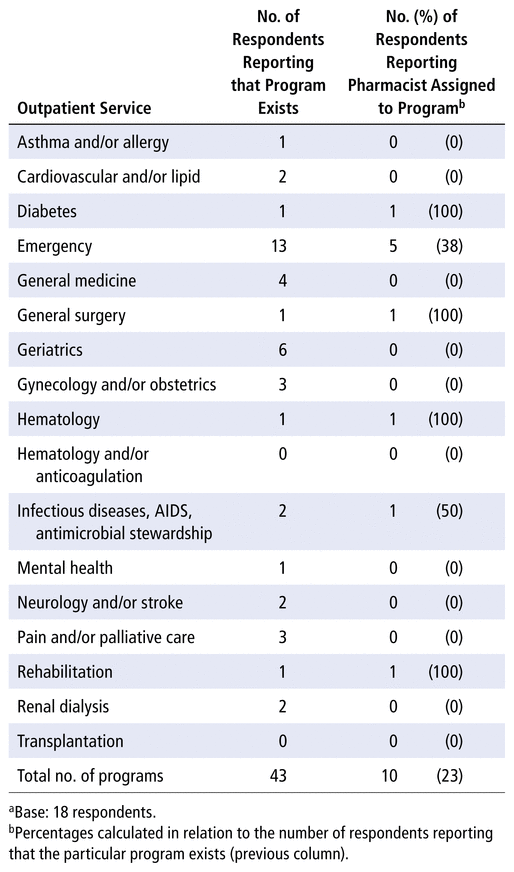
In 63% (15/24) of the hospitals surveyed, the pharmacy practice model was described as a “clinical generalist model with limited differentiation of roles” (i.e., nearly all pharmacists had both distribution and clinical responsibilities), with one-third of the remaining hospitals (33%, 3/9) having a practice model that was “mostly distributive pharmacists with limited clinical services”.3 The range of pharmacists’ clinical activities was vast, despite the small size of participating hospitals (Table 4). Clinical pharmacist activities reported for at least 50% of areas included review or approval of medication order sets, dosing adjustments, medication order review before administration of the first dose, prioritization of drug therapy management according to patient complexity, reporting of adverse drug reactions, clinical documentation, and medication-related continuity of care for discharged patients. Clinical pharmacist activities reported as existing in less than 50% of areas (some or none) were development of patient care plans, monitoring of responses to medication therapy, daily review of medication profiles, and writing of medication orders as part of their scope of practice. Medication reconciliation was not often completed by pharmacists in these facilities.
TABLE 4 Profile of Clinical Pharmacy Activitiesa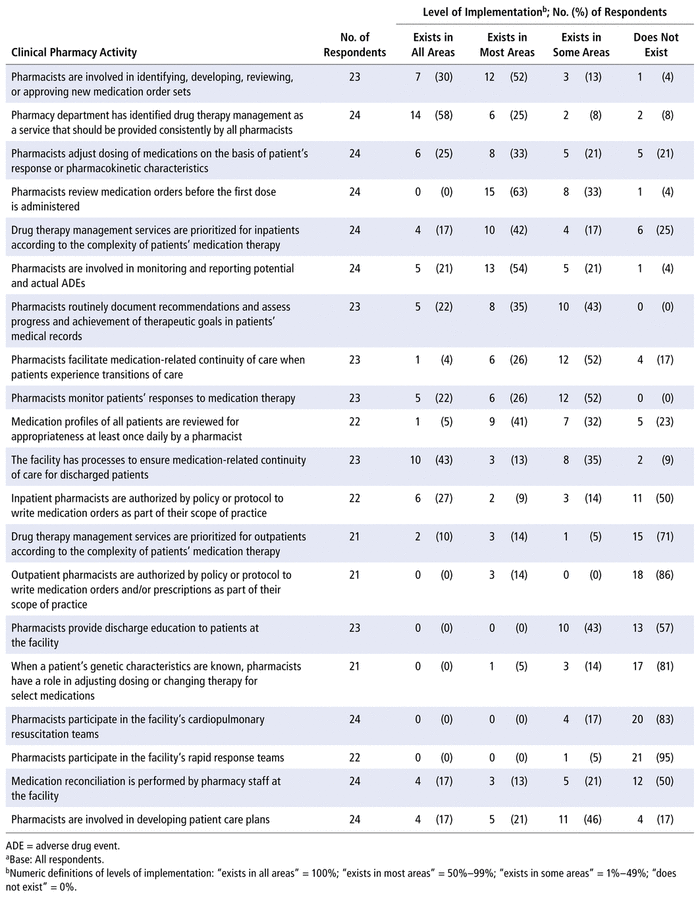
Survey responses revealed that the collection of data concerning clinical pharmacy key performance indicators (cpKPIs) was primarily aimed at medication reconciliation, on admission (for 76%–100% of patients) reported by 58% (14/24) of respondents and on discharge (for 76%–100% of patients) reported by 45% (9/20) of respondents (Table 5). For individual cpKPIs not currently collected, 30% to 47% of the participating small hospitals planned to do so in the next year.
TABLE 5 Clinical Pharmacy Key Performance Indicators (cpKPIs)a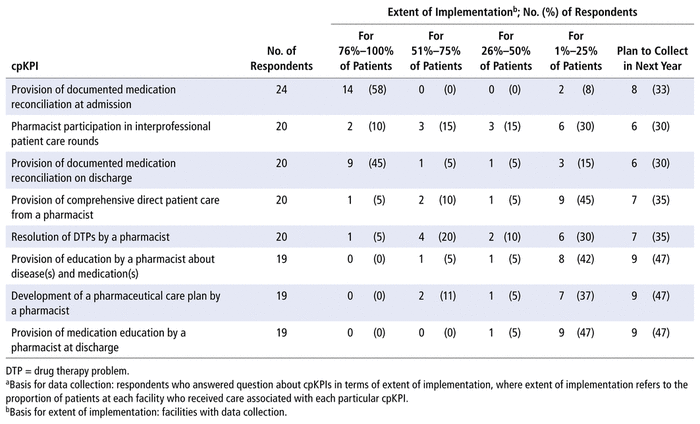
There was an equal distribution of approaches to evaluating clinical pharmacy services, ranging from a structured approach to defining and prioritizing pharmacists’ activities to currently determining a means to evaluate pharmacists’ direct patient care services (Table 6). Sixty-seven percent (8/12) of respondents used self-evaluation methods to assess the provision of direct patient care by pharmacists, and 33% (4/12) reported peer-review evaluation. In facilities where direct patient care pharmacy services were evaluated, 70% (7/10) assessed conformity of documentation with clinical practice and 50% (5/10) considered answers to drug information questions. Only 1 facility (4%) reported the presence of established mechanisms to measure medication-related outcomes.
TABLE 6 Evaluation of Clinical Pharmacy Services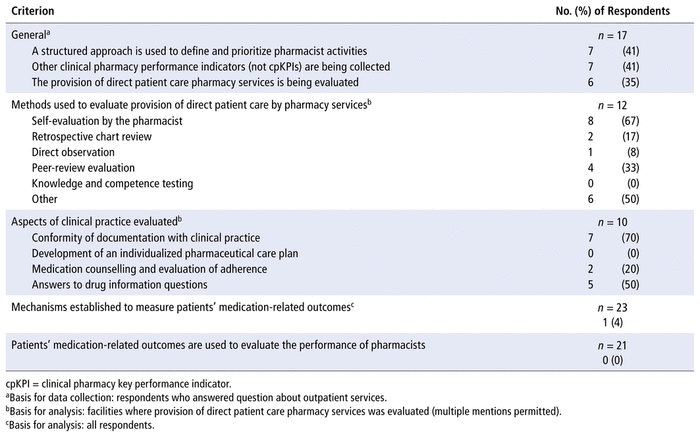
Facilities reported differences between acute and non-acute care beds in terms of the types of pharmacy drug distribution systems employed (Figure 2). Centralized unit-dose distribution (67%, 16/24) was the most common drug distribution system for acute care beds, with decentralized distribution from automatic dispensing cabinets (ADCs) for 63% (15/24) of respondents, and decentralized distribution from pharmacy satellites for 4% (1/24). Older drug distribution systems, specifically total wardstock (33%, 8/24) and traditional (13%, 3/24), remained in use for acute care beds. Non-acute care beds were serviced primarily by decentralized unit-dose ADCs (72%, 13/18), followed by a centralized unit-dose system (39%, 7/18). Eighteen facilities were using decentralized unit-dose ADCs, with 17 (94%) having them in the emergency department, 15 (83%) in general adult medical/surgical units, 6 (33%) in operating rooms, and 4 (22%) in recovery rooms (Table 7).
|
|
||
|
FIGURE 2 Percentage of respondents using various drug distribution systems for patient care areas with inpatient beds. The base for calculating percentages was the number of respondents with complete answers to questions about drug distribution systems. Individual respondents could provide multiple responses. |
||
TABLE 7 Automated Dispensing Cabinetsa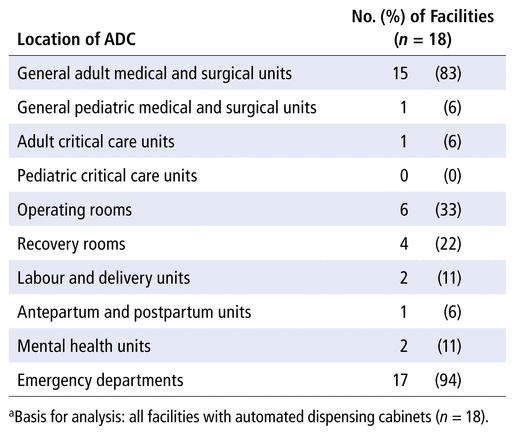
The task of order entry was performed by technicians at 71% (17/24) of the hospitals, by pharmacists at 42% (10/24), by others (e.g., nurses) at 21% (5/24), and by physicians at 17% (4/24) (Table 8). If order entry verification was required, pharmacists were most often responsible for this task. In 57% (4/7) of the facilities, pharmacist order entry did not require verification, compared with 33% (3/9) of facilities where physician order entry did not require verification.
TABLE 8 Medication Order Entry and Verificationa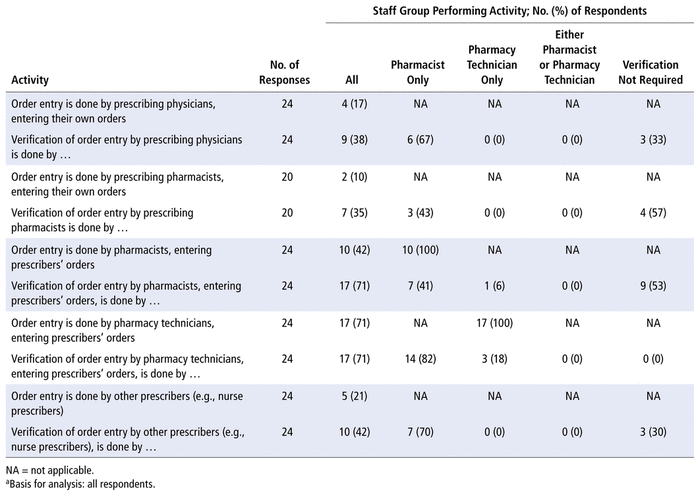
With regard to pharmacist review of at least 95% of all orders for appropriateness before medications were accessed at times when the hospital pharmacy department was closed, the responses varied: this occurred for 12% (2/17) of facilities with access to a night cupboard or similar after-hours medication supply system, for 18% (3/17) of those with ADC access, and for 24% (4/17) of respondents before medication orders appeared on the medication administration record (MAR). By comparison, when the pharmacy was open, pharmacist review of at least 95% of routine medication orders before medications were dispensed from the central or satellite pharmacy was reported by 45% (9/20) of respondents, before medications were dispensed from ADCs by 60% (12/20), and before appearance of the order on the MAR by 40% (8/20). For all respondents, the mean total weekly time that pharmacists spent on order verification was 66.4 hours, including weekdays and weekends.
The majority of hospital MARs (75%, 18/24) were generated in hard copy using the pharmacy information system, with manual documentation of the doses administered. In more advanced facilities, 21% (5/24) of MARs were derived electronically from databases aligned with the pharmacy information system, with electronic documentation of administered doses.
In most facilities (61%, 14/23), pharmacy departments did not offer sterile compounding services for nonhazardous medications. Where the pharmacy department did offer sterile compounding services for nonhazardous medications, the medications were supplied by external providers for 26% (6/23), with the remainder supplied by the pharmacy department (13%, 3/23). Hence, most facilities (80%, 16/20) reported no physical space requirements for sterile compounding services of nonhazardous medications, such that 83% (15/18) of facilities had not adopted the standard operating procedures outlined in the USP General Chapter <797> standards.9
Similarly, more than half of the facilities reported that compounding services for nonhazardous medications were not required for their patient population, and where such services were required, 30% (7/23) of respondents reported that nonhazardous compounds were supplied by external providers. Moreover, 59% (10/17) of respondents reported that their facility’s infrastructure did not support sterile compounding services for hazardous compounds to meet compliance standards. Adherence to USP General Chapter <797> standards9 for beyond-use dating of sterile compounded nonhazardous and hazardous products was reported by 38% (5/13) and 50% (6/12) of respondents, respectively.
None of the small hospitals responding to this survey could provide data about drug costs; however, based on data from 5 hospitals, the median reported inventory turnover rate was 4.9 (interquartile range 4–6.5) per year.
With the exception of a 7% vacancy rate for staff pharmacists, no hospitals reported unfilled pharmacy services positions. The typical staff composition, based on FTE positions, consisted of 20% staff pharmacists, 53% registered pharmacy technicians, 16% pharmacy assistants, and 11% pharmacy department managers (10% of whom were pharmacists). Analysis showed that if all pharmacy positions were considered, regardless of existing within respective pharmacy departments (reported FTE position ≥ 0; Table 9), the median total pharmacy department staffing was 2.8 FTEs. Medians by professional group were 0.5 FTE for staff pharmacists, 1.5 FTEs for technicians, 0 FTEs for pharmacy assistants, 0 FTEs for pharmacy nurses, and 0.3 FTE for pharmacist managers, with an overall ratio of pharmacists to nonpharmacists (technicians, pharmacy assistants, pharmacy nurses) of 0.5:1.8. In this analysis, total budgeted hours, expressed in terms of FTE, per acute and non-acute patient-day for technicians was considerably higher than for all other pharmacy positions (0.5 versus 0–0.1, Table 9).
TABLE 9 Budgeted Pharmacy Staffing and Staffing Ratios, as Budgeted Hours/Patient-Day, for All Facilities (FTE ≥ 0)a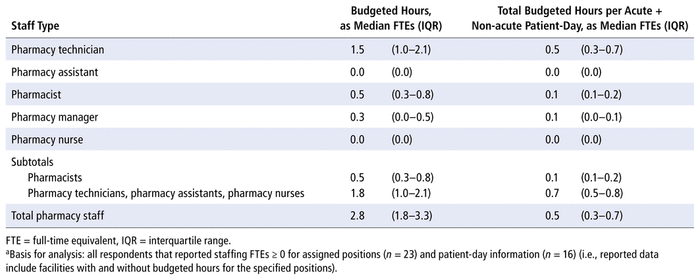
According to further analysis of data from respondents who reported FTE staffing for specific pharmacy positions that existed within their pharmacy departments (a reported FTE position > 0, Table 10), the median total departmental staffing was 2.7 FTEs. Of the allocated total 2.7 FTEs, the median FTEs for staff positions were 0.6 for pharmacists, 1.9 for technicians, 0.8 for pharmacy assistants, 0.5 for pharmacy nurses, and 0.5 for pharmacist managers. The ratio of pharmacists to nonpharmacists (technicians, pharmacy assistants, pharmacy nurses) was 0.6:1.8. Total budgeted hours, expressed in terms of FTE, per acute and non-acute patient-day for technicians was 5 times higher than for all other pharmacy positions (0.5 versus 0.1, Table 10). Total budgeted hours for non-acute plus acute patient-days was 0.7 FTE and for acute patient-days was 1.3 FTE (Table 11).
TABLE 10 Budgeted Pharmacy Staffing and Staffing Ratios, as Budgeted Hours/Patient-Day, for Facilities with Budgeted Positions (FTE > 0)a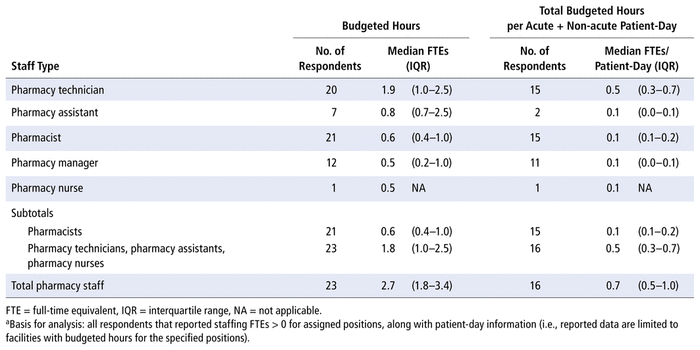
TABLE 11 Staffing Ratiosa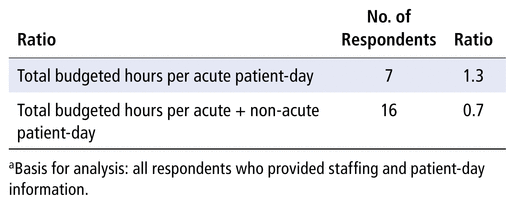
This survey, with its high response rate, provides a snapshot of Canadian community hospitals with fewer than 50 acute care beds that are supported by third-party telepharmacy services. To our knowledge, this is the first survey assessing pharmacy distribution, clinical, and management services in small Canadian hospitals.
The results revealed that the numbers of both inpatient and outpatient programs and the proportion of these programs with a pharmacist assigned were far lower than in larger hospitals surveyed in 2016/17, as documented in the Hospital Pharmacy in Canada Report.3 We found that the pharmacist clinical practice models in small hospitals echoed those of hospitals with 50–200 acute care beds,3 as did the extent of a broad range of clinical pharmacy activities provided. Relative to their larger counterparts, a much higher proportion of the small hospitals had a “mostly distributive pharmacists with limited clinical services” model (10% versus 33%). In contrast to facilities with 50–200 beds, pharmacists’ clinical activities were vast, despite the small size of responding hospitals. In hospitals with 50–200 beds, medication reconciliation was primarily conducted by pharmacists, whereas this task was often conducted by nonpharmacy staff in the smaller hospitals in our survey. Despite the support of telepharmacy services, we think that low overall pharmacy staffing and limited hours of operation meant that pharmacists working at small hospitals were less involved in performing daily medication review, developing patient care plans, monitoring therapy, and facilitating medication-related continuity of care when patients transitioned within and out of hospital, including discharge patient education.
In these small hospitals, medication reconciliation at the time of admission was the highest cpKPI, similar to that of hospitals with 50–200 beds and 3 times that of hospitals with more than 500 beds.3 Moreover, our study found that hospitals with fewer than 50 acute care beds exceeded all other categories of hospital size and type in terms of medication reconciliation on discharge. As indicators of evidence-based processes of care, cpKPIs are in “the domain of clinical pharmacy services that are associated with a meaningful impact on patient outcomes”.3 In responding to our survey, hospital and pharmacy leadership often retrieved medication reconciliation frequencies from hospital data, as opposed to identifying medication reconciliation completed specifically by pharmacists. Despite our attempt to compare medication reconciliation cpKPI frequencies with data for larger hospitals in the Hospital Pharmacy in Canada Report,3 it remains unclear whether the data for larger hospitals are based on medication reconciliation conducted by pharmacists only or if they represent hospital-wide data. Clarity will be needed in future surveys of small and larger hospitals to distinguish between medication reconciliation conducted by pharmacists and medication reconciliation conducted by other providers.
In the small hospitals responding to this survey, evaluation of pharmacists’ provision of direct patient care was often by self-evaluation, most likely because of limited resources for peer or management review; furthermore, if an aspect of pharmacist clinical practice was to be evaluated, it was primarily an assessment of conformity of documentation.
Unit-dose drug distribution, ADCs, and traditional drug distribution systems were used at the same frequencies as in larger facilities. In contrast, smaller hospitals had less decentralized unit-dose satellites and higher use of the outdated wardstock distribution system.
The greatest disparity in pharmacy services between small and larger hospitals lay in weekly hours of operation of the pharmacy: 41.5 compared with 84 hours/week. However, when we explored pharmacy departments included in our survey that were supported by telepharmacist medication order verification outside the standard hours of operation of the hospital pharmacy department reported by respondents, the mean total weekly hours of pharmacist order verification was 66.4 hours (unpublished internal data), demonstrating that telepharmacists could extend the pharmacy’s usual weekly hours of operation.
Parallel to larger facilities, most medication order entry was performed by pharmacists and pharmacy technicians, with verification performed primarily by pharmacists. Our survey found that small hospitals, like larger Canadian hospitals, continued to lag behind facilities in the United States, where more than 90% of medication orders are received electronically through computerized prescriber order entry.6 As might have been expected, with the support of after-hours telepharmacy services for some of the small hospitals surveyed, a greater proportion of these sites, relative to larger hospitals (12%–18% versus 1%–3%), had at least 95% of medication orders reviewed for appropriateness before ADC access, night cupboard access, or appearance of the order on the MAR, regardless of the pharmacy’s hours of operation. Despite similar standards in Canada and the United States, 90% of respondents to the 2016 ASHP survey5 indicated that all medication orders, regardless of time of day, were reviewed by a pharmacist before administration, including 81% of respondents in hospitals with fewer than 50 beds.
Unlike their larger counterparts in Canada, small hospitals did not provide the majority of sterile compounding unless these products were obtained from an external provider. The reasons for this situation were not identified in this survey, although they may include a lack of pharmacy resources, the facility’s particular patient population, or the available hospital programs and services.
Total budgeted hours per acute patient-day (which excludes non-acute care beds from the denominator but includes budgeted hours for non-acute care beds and ambulatory care services) was 1.3 FTE, higher than for all hospital size categories in the Hospital Pharmacy in Canada Report (0.99 FTE).3 However, the ratio of total budgeted hours to total (acute + non-acute) patient-days was aligned with that stated in the Report (0.7 FTE).3 This ratio should be interpreted with caution given the potential broad distribution in the proportion of acute care beds. As mentioned in the Report,3 the most accurate view of resources used specifically for staffing inpatient acute care beds is inpatient budgeted hours per acute inpatient day. The majority of respondents to our survey were unable to provide data for non-acute care and acute care workloads separately. Nevertheless, reported median total pharmacy staff composition in the small hospitals was drastically below that for hospitals with 50–200 beds (2.7 FTE versus 17 FTE).3 Moreover, the difference in ratio of pharmacists to pharmacy technicians, pharmacy assistants, and pharmacy nurses in small hospitals compared with larger facilities (1:2.0 versus 1:1.5) is worth some attention. This difference may suggest that pharmacy departments in small hospitals could benefit from an increased FTE pharmacist complement to more closely mirror the pharmacist activities and services provided in larger hospitals. In addition, the pharmacy staffing complement differed substantially between the small hospitals and larger facilities in terms of pharmacists (20% versus 40%), technicians (53% versus 28%), assistants (16% versus 23%), and managers (11% versus 5%). These results suggest that small hospitals may be in need of increased human resources and that realignment of pharmacy staffing may be warranted.
This survey collected data from 3 Canadian provinces on distribution, clinical, and management services of pharmacy departments in hospitals with fewer than 50 acute care beds that had such services provided, either fully or in part, by a single telepharmacy provider. The results may not be generalizable to hospitals outside the 2 large provinces and the small prairie province where the survey was conducted; similarly, the results may not be generalizable to small hospital pharmacies with on-site pharmacist support only or to those with a different telepharmacy provider. Nonetheless, based on the high response rate and congruence of many of the results with the most recent (2016/17) Hospital Pharmacy in Canada Report, the present study design and data analysis are likely reproducible and applicable to a broader group of pharmacy departments in small hospitals across Canada. A larger study of small hospitals across Canada, with and without the support of telepharmacy services, is very much needed.
To the authors’ knowledge, this is the first study to describe pharmacy distribution, clinical, and management services in small Canadian hospitals. Representing approximately 12% of hospitals with fewer than 50 acute care beds in Canada, our survey has provided valuable quantitative data on pharmacy distribution, clinical, and management information previously unknown to hospital and pharmacy leadership. Although small hospitals have many similarities to larger facilities in terms of the broad services provided by their pharmacy departments, there are many substantial gaps between small and large hospitals in the extent of resources and services available. Human resource metrics for small hospitals, such as staffing ratios, are well below those of larger hospitals, and significant differences in staffing complements require attention. Not surprisingly, given the small size of participating hospitals, many program and service questions mirroring the most recent CSHP Hospital Pharmacy in Canada Survey were not applicable. Customization and dissemination of a survey specifically designed for smaller hospitals may be more efficient and provide much-needed data. It is paramount that the data necessary to benchmark, plan, and expand pharmacy services of small and often remote community hospitals be collected and disseminated, to help ensure that all Canadians have access to equitable care.
1 Wright A, Vaillancourt R, Bussières JF, Lebel D, Wong E, Mancini D, et al. Best of both worlds: a comparison of Canadian and international best practices for hospital pharmacy services. Can J Hosp Pharm. 2015; 68(1):48–53.
PubMed PMC
2 Harding J, Long S. Canadian hospital pharmacy survey. Can J Hosp Pharm. 2003;56(2):102.
3 Hospital Pharmacy in Canada Survey Board. Hospital pharmacy in Canada report 2016/17. Canadian Society of Hospital Pharmacists; 2018 [cited 2021 Jun 3]. Available from: https://cshp.ca/document/4566/Report%202018.pdf
4 Hospital Pharmacy in Canada Editorial Board. Hospital pharmacy in Canada 2009/2010 report. Eli Lilly; 2010 [cited 2021 Jun 9]. Available from: https://cshp.ca/document/4561/2009_2010_full_E.pdf
5 Pedersen CA, Schneider PJ, Scheckelhoff DJ. ASHP national survey of pharmacy practice in hospital settings: prescribing and transcribing—2016. Am J Health Syst Pharm. 2017;74(17):1336–52.
Crossref PubMed
6 Pedersen CA, Schneider PJ, Scheckelhoff DJ. ASHP national survey of pharmacy practice in hospital settings: monitoring and patient education—2015. Am J Health Syst Pharm. 2016;73(17):1307–30.
Crossref PubMed
7 Schneider PJ, Pedersen CA, Scheckelhoff DJ. ASHP national survey of pharmacy practice in hospital settings: dispensing and administration—2017. Am J Health Syst Pharm. 2018;75(16):1203–26.
Crossref PubMed
8 CIHI Portal: Hospital beds staffed and in operation, 2017–2018. Canadian Institute for Health Information; release 2019 Mar 21 [cited 2019 Oct 31]. Available from: https://www.cihi.ca/sites/default/files/document/beds-staffed-and-in-operation-2017-2018-en-web-revmay3.xlsx
9 General chapter <797>: pharmaceutical compounding — sterile preparations. In: United States Pharmacopeia 36. United States Pharmacopeial Convention; 2013.
Competing interests: The authors’ employer, Northwest Telepharmacy Solutions, was involved in the design and conduct of this study; collection, management, and interpretation of the data; and the preparation, review, and approval of the manuscript. No other competing interests were declared. ( Return to Text )
Funding: None received. In-kind support was provided by Northwest Telepharmacy Solutions. ( Return to Text )
The authors thank the small-hospital and pharmacy leadership of institutions that participated in this study, as well as pharmacists with Northwest Telepharmacy Solutions, who provided support and time to complete the surveys.
Canadian Journal of Hospital Pharmacy, VOLUME 74, NUMBER 3, Summer 2021